Demand Inertia and the Hidden Impact of Pharmacy Benefit Managers
Management Science 70(12), 2024, 8940–8961
Author’s version(PDF) · Journal version · Online appendix(PDF) · Replication code
Policy citations: HHS ASPE report (2024)
What Do Pharmacy Benefit Managers Do?
Pharmacy Benefit Managers (PBMs) negotiate drug prices on behalf of large payers like employers, unions, and insurers. They design drug benefits for almost 80% of insured Americans across the commercial market, Medicare Part D, and the ACA exchanges. Their main tool is the formulary, a tiered menu of drugs. Manufacturers offer rebates in exchange for better formulary placement. Drugs with very high prices can even be excluded from coverage altogether. PBMs claim these negotiations control spending. Critics argue they have done little to slow the price growth of branded drugs.
Do PBMs Actually Lower Drug Prices?
The evidence points in two contrasting directions:
- Drugs with higher net prices receive worse formulary coverage, which suggests PBMs enforce a real tradeoff between price and access.
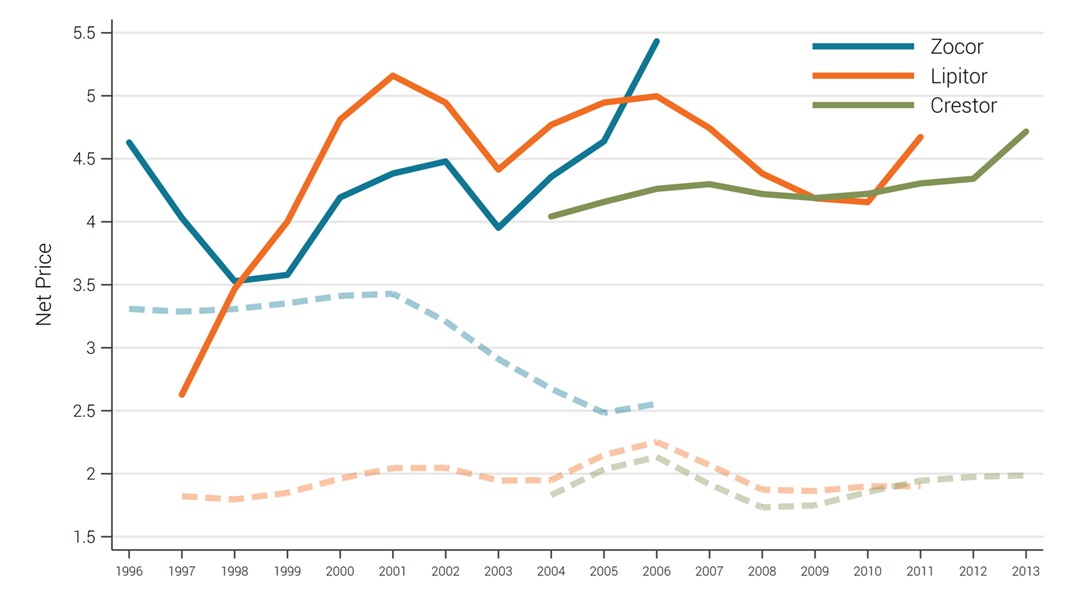
- Yet net-of-rebate prices grow consistently over time, and they do not fall when close therapeutic substitutes enter the market.
These two facts are hard to reconcile. If PBMs can punish high prices with worse coverage, why can they not turn new competition into bigger discounts?
We argue that demand inertia hides the impact of PBMs on drug prices. Most prescriptions treat chronic conditions, and patients rarely switch between competing drugs once therapy starts. This inertia affects pricing in two ways. First, manufacturers raise prices over time: as a drug’s customer base matures, the incentive shifts from attracting new patients to extracting higher markups from existing ones. Second, later entrants are at a disadvantage when competing for patients who have already started treatment, which weakens competition. As a result, prices can rise even when PBMs are effective at restraining them, making PBMs appear ineffective in the raw data.
Isolating the Impact of PBMs
- We build a dynamic model of drug pricing. Manufacturers submit prices to a PBM, and the PBM responds by placing each drug on a preferred or non-preferred tier or excluding it from coverage.
- We estimate the model on the market for medium-intensity statins from 1996 to 2013, using net-of-rebate prices estimated from manufacturers’ financial filings (the same approach used by SSR Health, whose data begin only in 2007) and patient-level claims from MarketScan and MEPS.
- Inertia is captured by a switching-cost model of demand, estimated using quasi-exogenous variation in the choice sets patients face.
The Impact of PBMs on Drug Prices and Spending
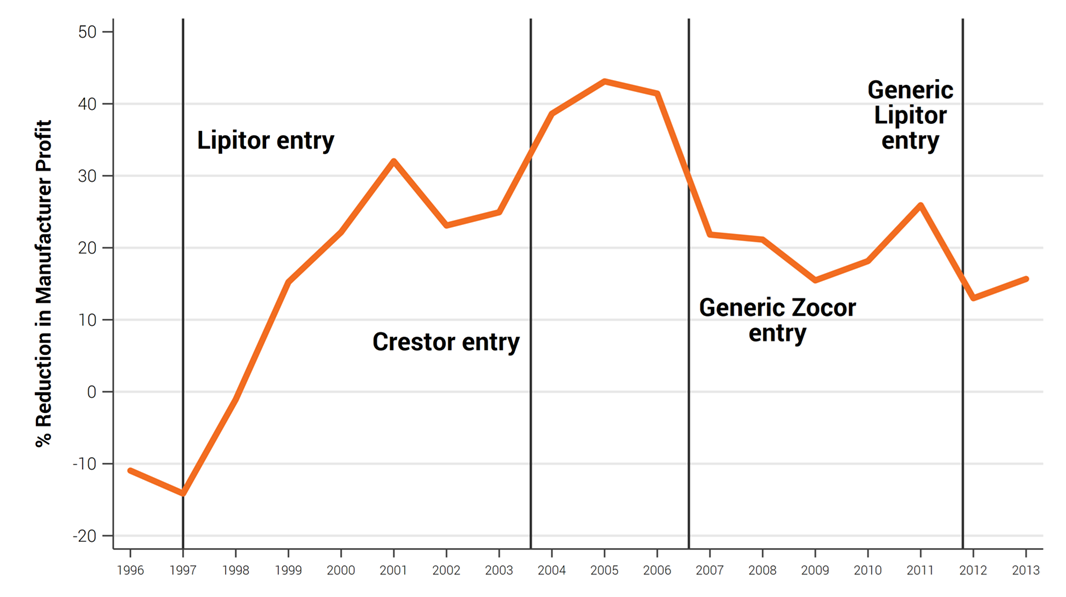
- PBMs reduced total spending on statins by about 28% relative to a market where manufacturers set prices directly and patients pay flat coinsurance, even after accounting for PBM fees.
- The savings do not come at patients’ expense. In the counterfactual without PBMs, cost sharing rises and access to medication worsens.
- The key tool is the threat of exclusion. Limiting the PBM’s ability to exclude drugs leads to a substantial increase in spending, even though drugs are rarely excluded in equilibrium. The threat creates downward pressure on prices without being acted upon. The design of the tier structure matters much less.
| Scenario | Total spending ($ billions) |
|---|---|
| Baseline (with PBMs) | 175.0 |
| No PBMs (flat 33% coinsurance) | 242.5 |
| PBMs allowed at most one exclusion | 269.0 |
| Single-tier formulary | 176.9 |
- Without demand inertia, prices would fall visibly as competitors enter. The market for Hepatitis C cures shows this pattern: patients are cured in weeks, so inertia plays no role, and net prices have fallen year after year as competing cures entered.
Key Takeaways
- Judging PBMs by whether prices fall after new entry understates their impact. Demand inertia masks the savings they generate.
- Formulary exclusions are unpopular, but the credible threat of exclusion is what generates discounts. Policies that restrict exclusions may raise spending with little gain in patient access.