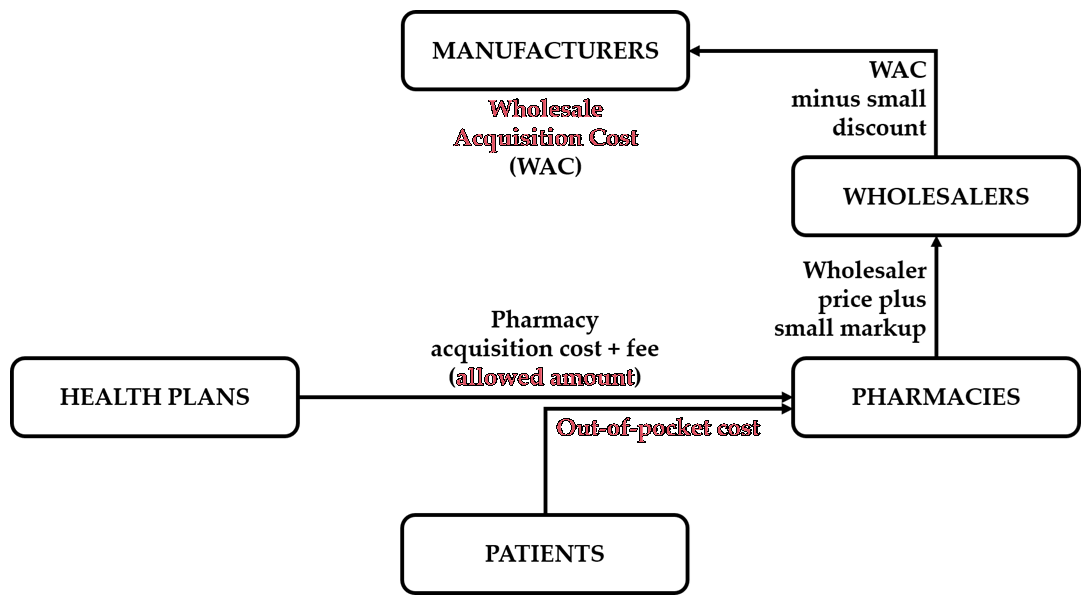
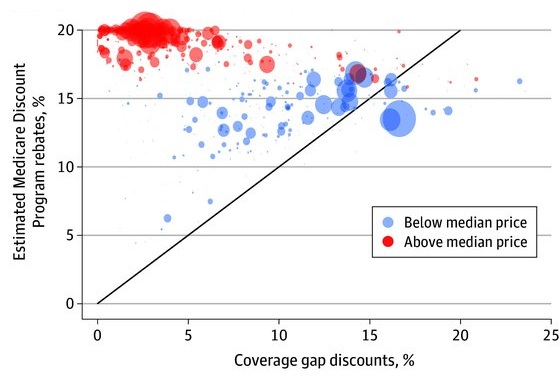
The cost of U.S. prescription drugs depends on nominal “list” prices and confidential rebates, both of which have grown substantially over time, puzzling regulators. We argue that plans that are constrained in how they set patient cost-sharing have an incentive to cover higher-list-price drugs and pass through those higher prices to patient out-of-pocket costs. Using an instrumental variable approach, we show that increases in list prices pass through one-to-one to increases in out-of-pocket costs in Medicare Part D and commercial high-deductible health plans, where cost-sharing is constrained, but not in commercial PPO and HMO plans that can set cost-sharing freely.
Working paper (revisions requested at American Economic Review)
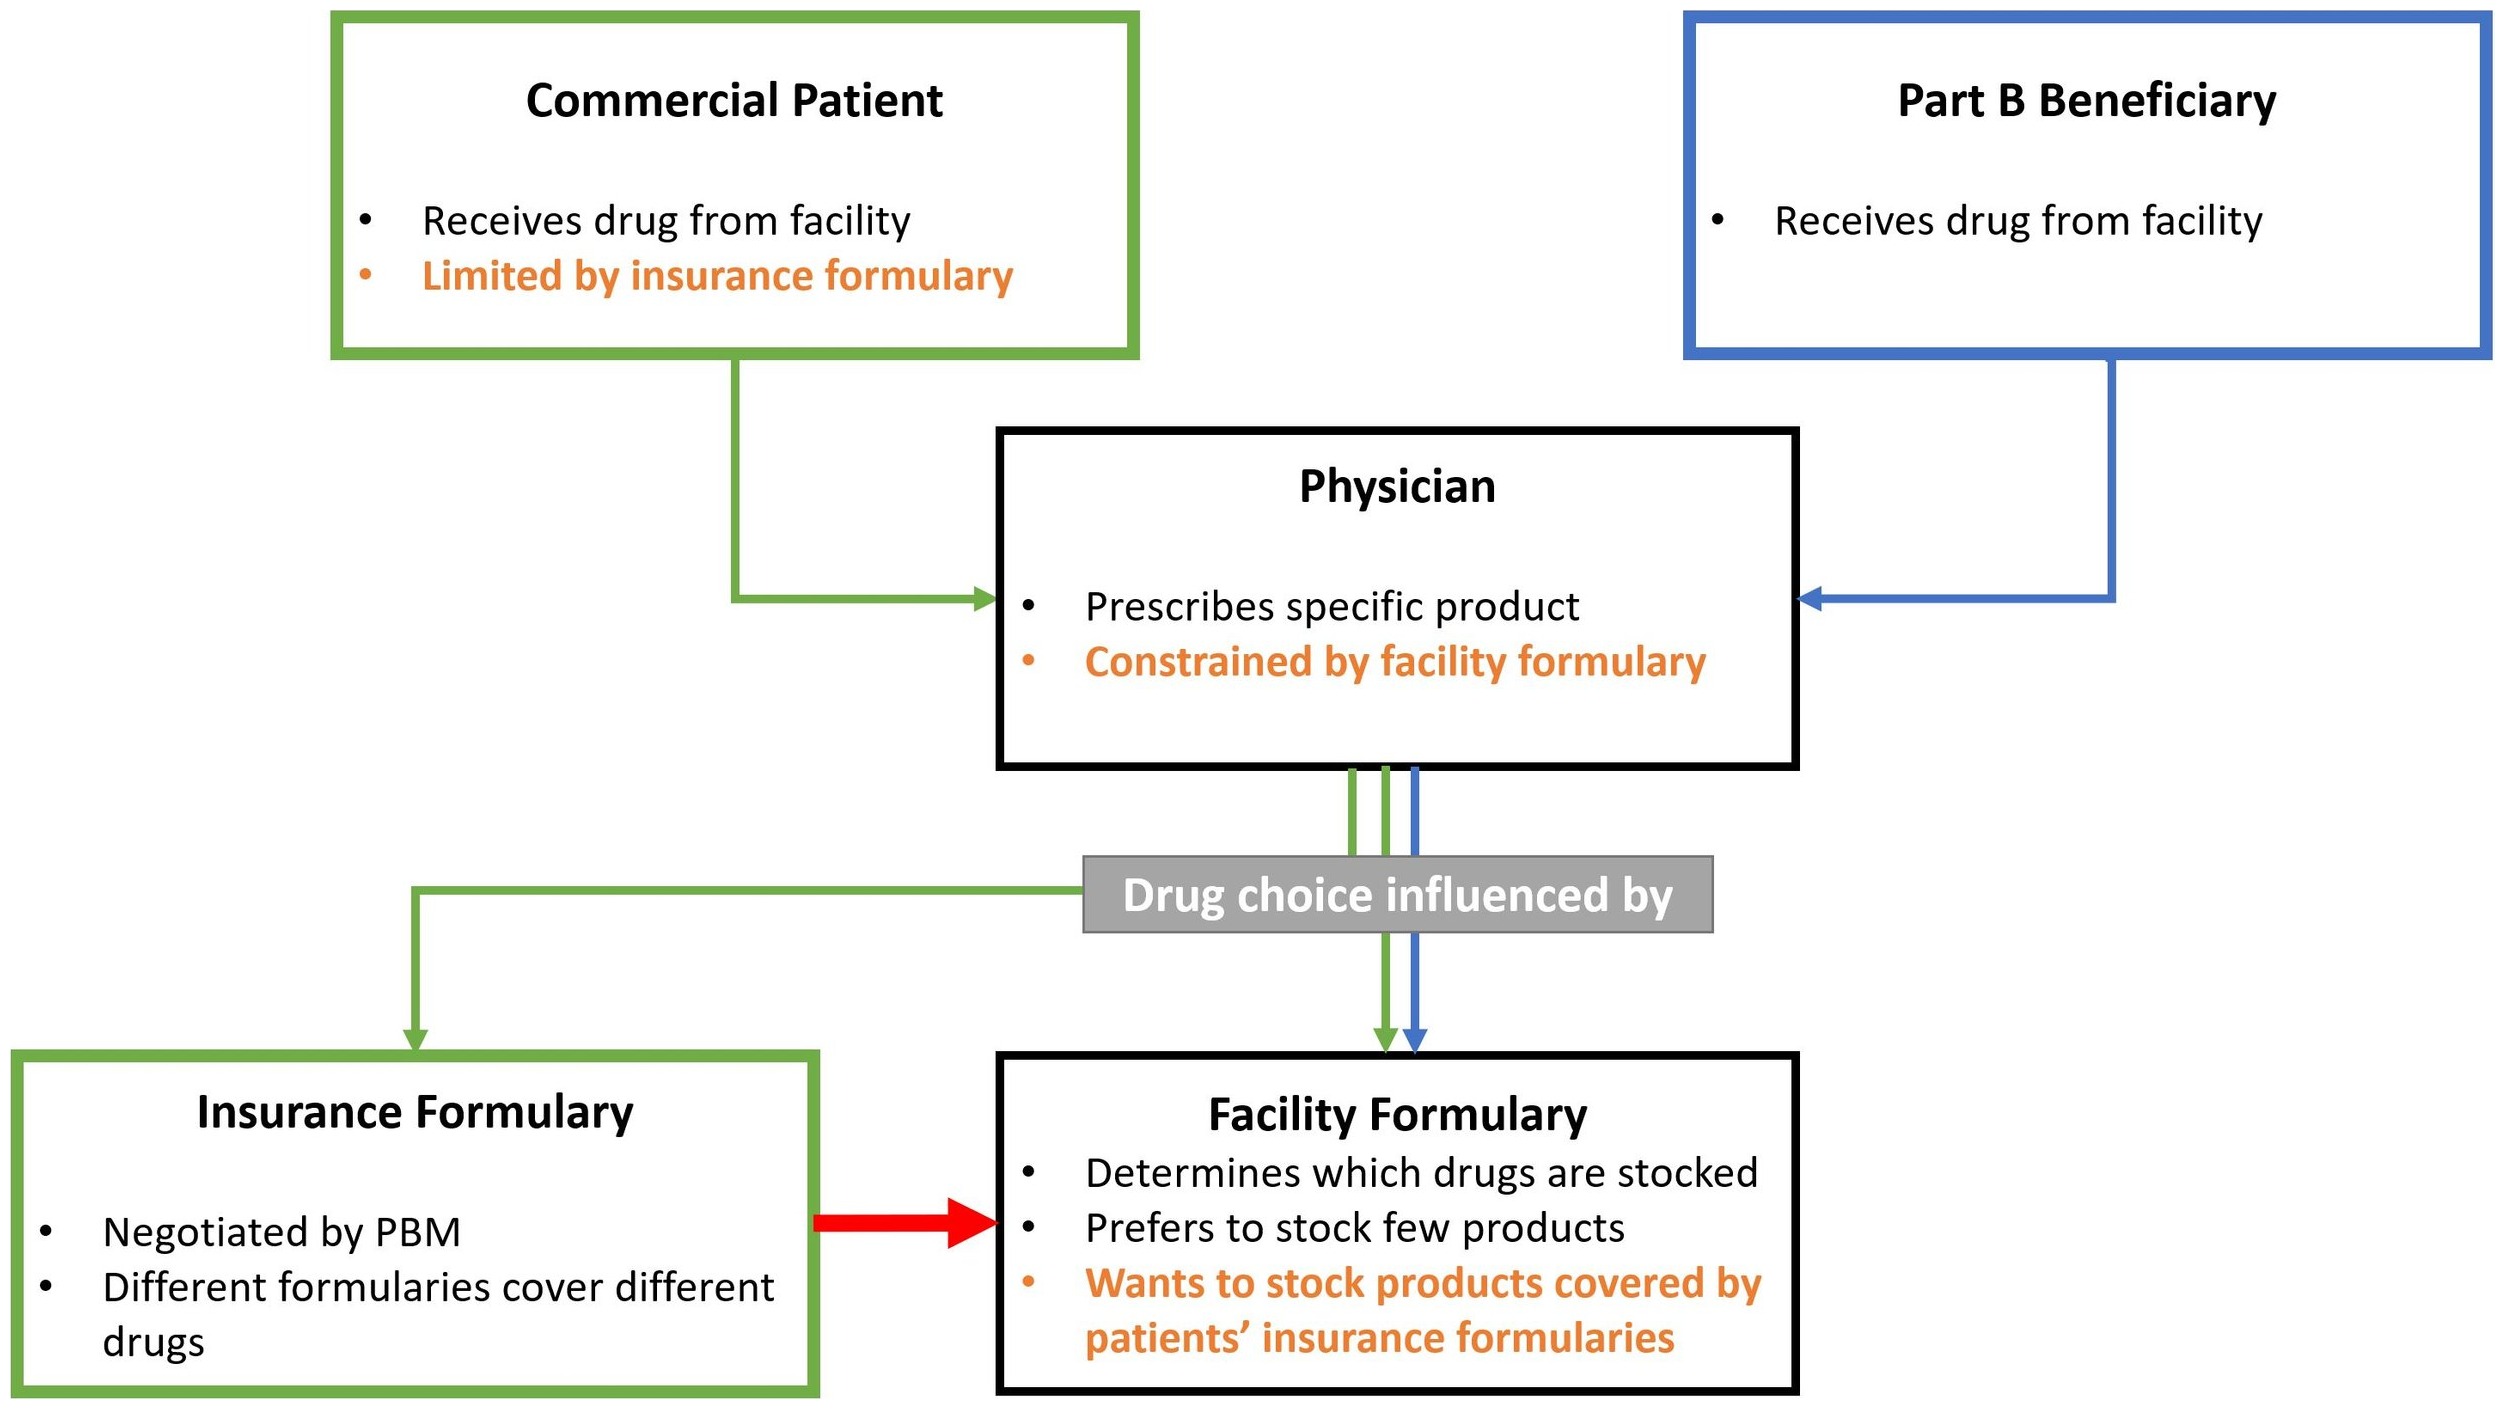
We show that variation in state-level commercial coverage of physician-administered drugs impacts Medicare patients’ utilization: a 10pp increase in commercial exclusion rates leads to a 0.9-1.7pp reduction in share among Part B beneficiaries. Facilities, rather than physicians, drive prescribing variation, likely through the preferred stocking of products with better commercial coverage. Motivated by these findings, we calibrate a model of manufacturer competition over insurance coverage and facility stocking, and find that the stocking channel weakens the government’s ability to influence Medicare utilization and that manufacturers can strategically use formulary coverage to soften price competition over facility stocking.
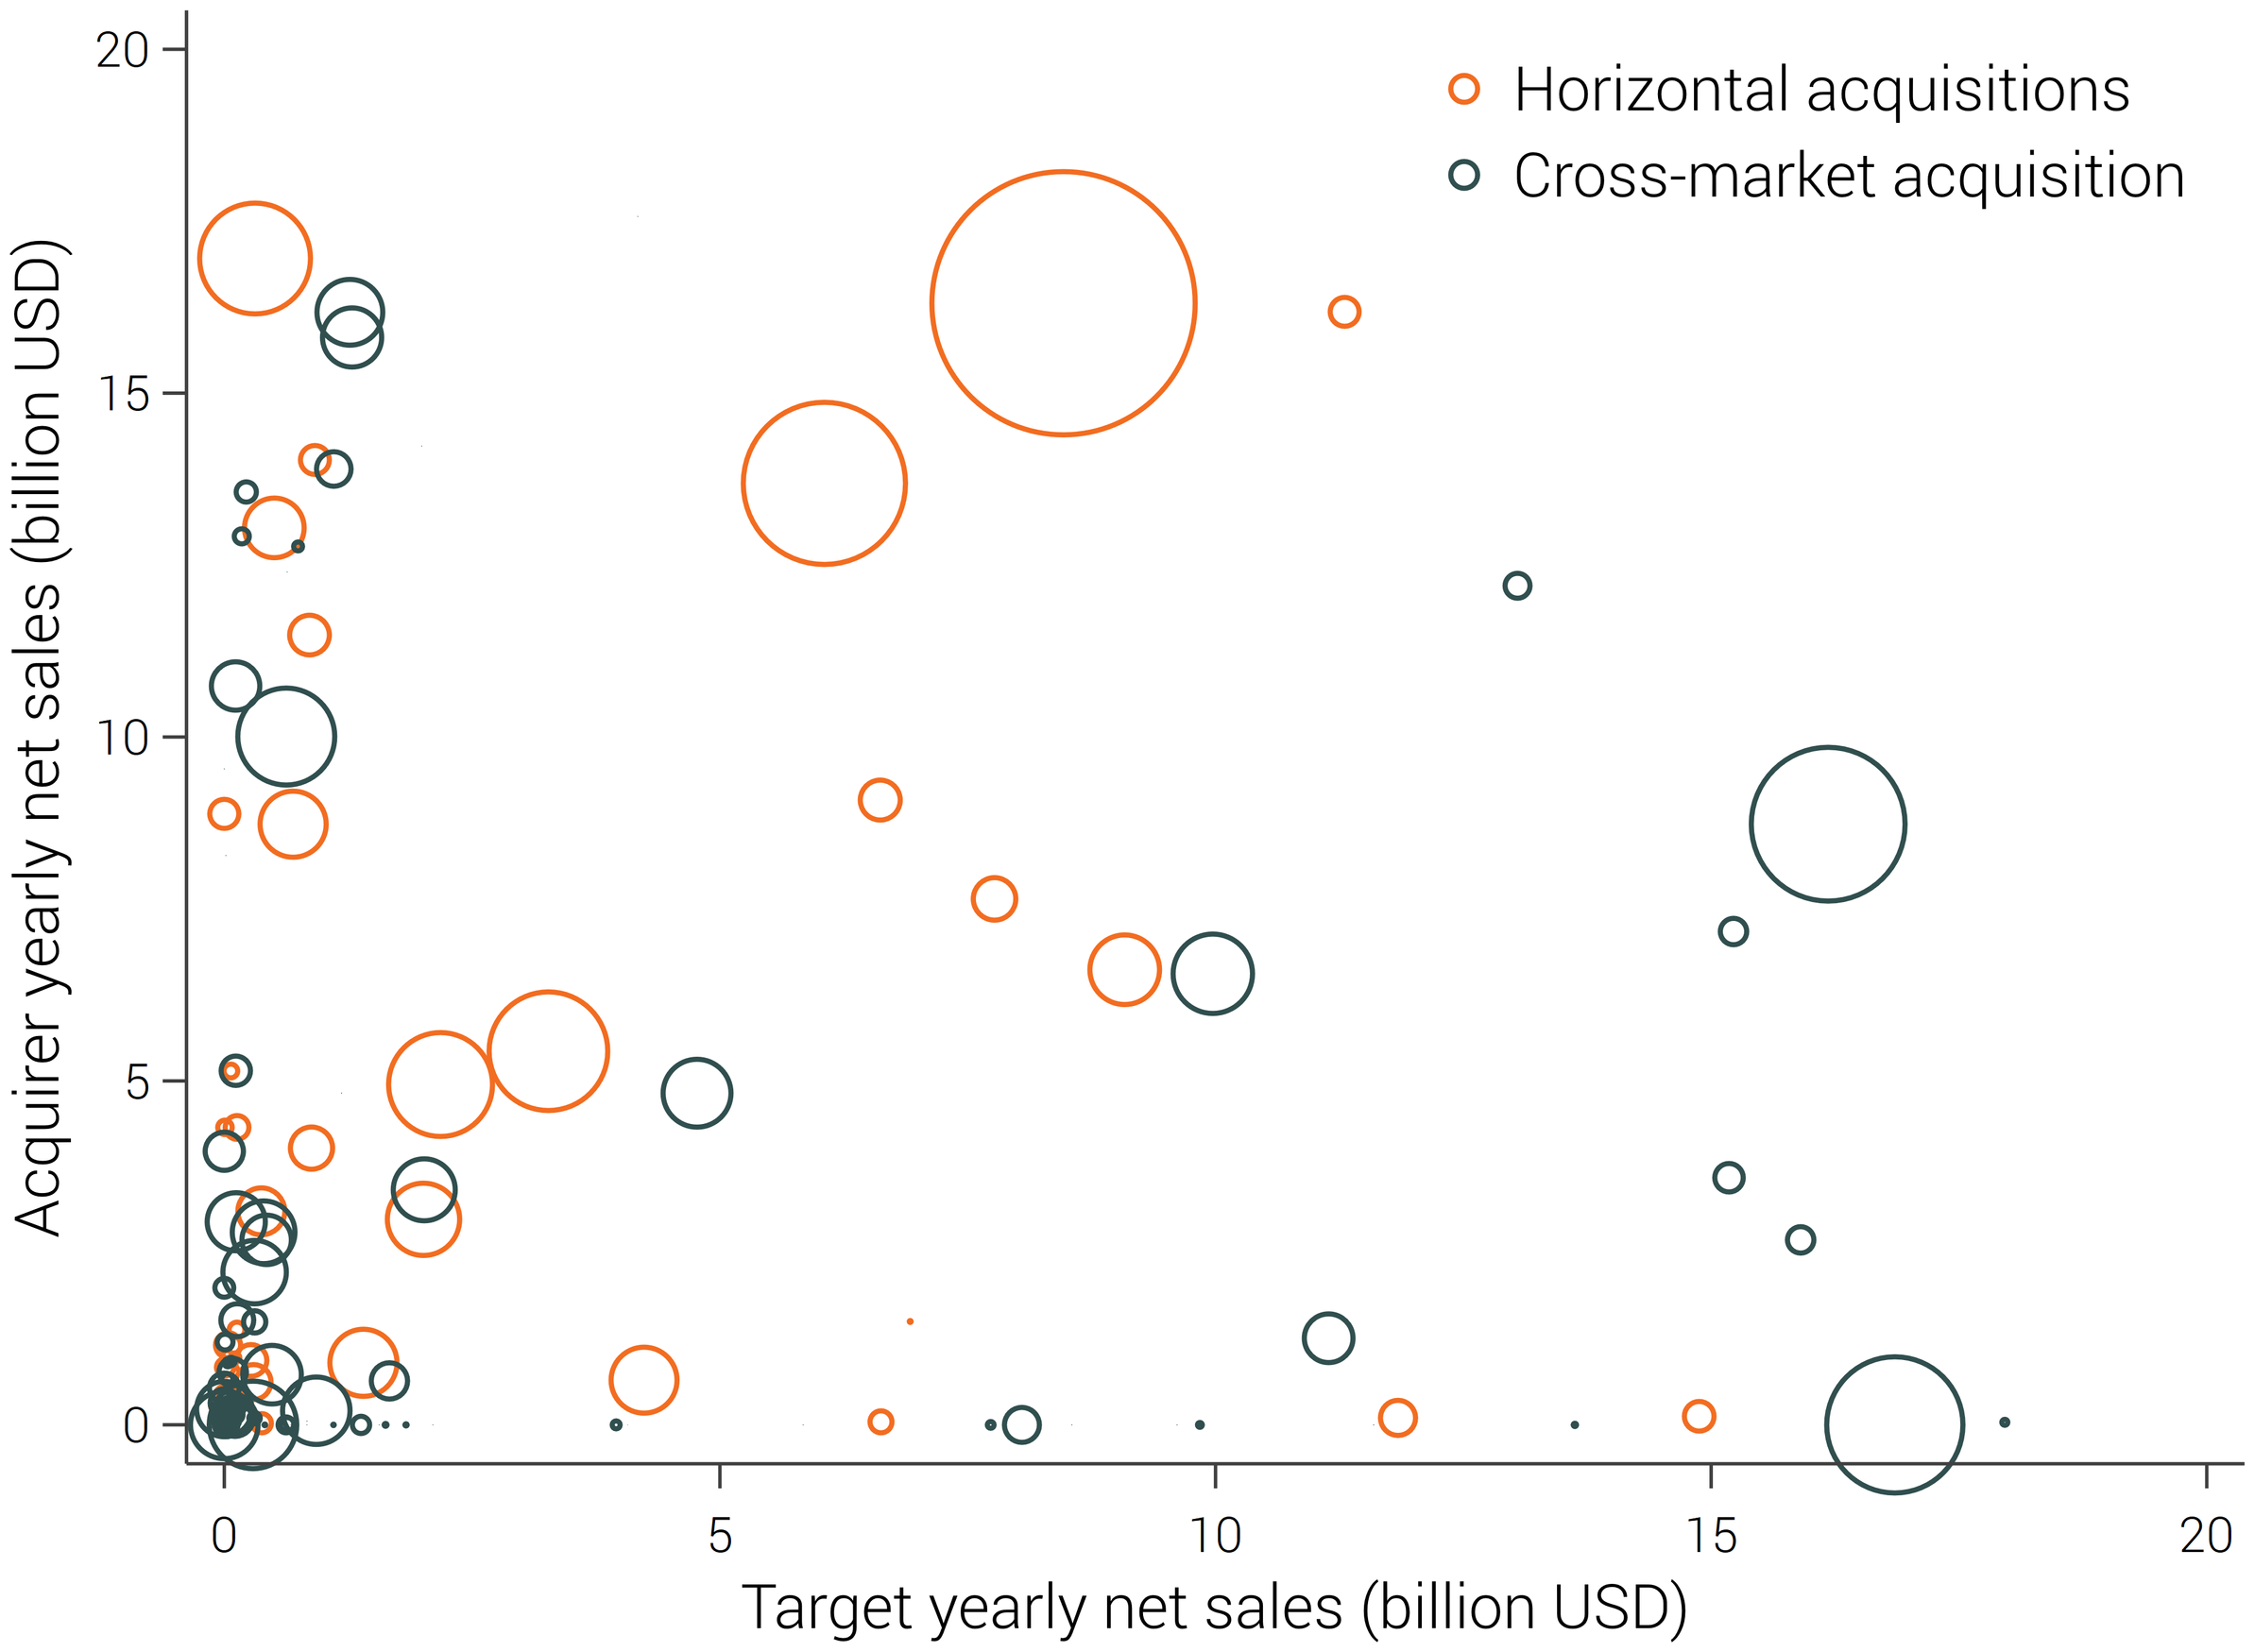
Which acquisitions lead to higher prescription drug prices? Using a novel dataset of acquisitions, prices, and coverage of branded drugs, we uncover two patterns. First, net-of-rebates prices of drugs with similar indications involved in deals undisclosed to regulators increase by over 88 percent, while their coverage declines. Acquisitions disclosed to regulators are followed by much smaller effects. Second, acquisitions that consolidate drugs with different indications leave markets unaffected on average, but are occasionally followed by prices increases when they significantly expand a company’s portfolio. We provide suggestive evidence that these differences stem from specific features of the industry’s bargaining structure.
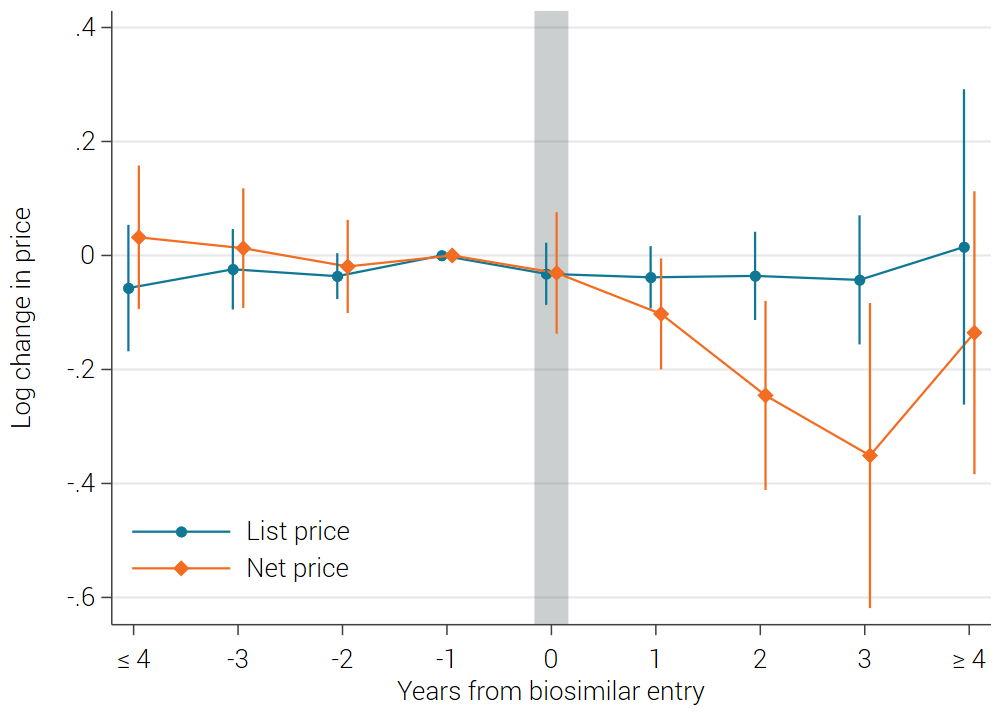
Unlike small-molecule drugs, biologics cannot be exactly replicated and instead face post-exclusivity competition from non-identical copies called biosimilars. Under a stylized model with a loyal segment of consumers, greater differences between incumbent and entrant can lead incumbents to “fight” rather than “acquiesce.” Consistent with this prediction, we find that, on average, biologics respond to biosimilar entry by sharply reducing net-of-rebate prices to maintain volume—unlike small molecule incumbents. In addition, we provide suggestive evidence that proxies of biosimilar entrant quality and loyal segment size are associated with smaller price responses.
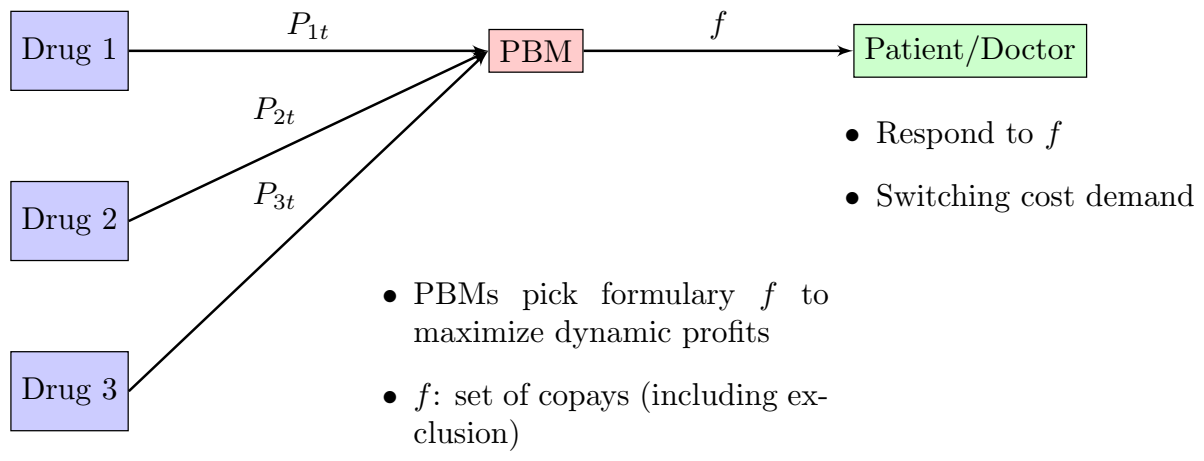
Do pharmacy benefit managers (PBMs) reduce spending on prescription drugs? Reduced-form evidence suggests that PBMs enforce a tradeoff between net-of-rebate prices and access to drugs within each market. However, net-of-rebate prices grow consistently over time and appear unresponsive to competitor entry. We argue that inertia in drug demand can reconcile these facts. To formally analyze the roles played by PBMs and demand inertia, we build a dynamic structural model of drug pricing and estimate it using net-of-rebate prices of three major statins from 1996 to 2013. Counterfactuals suggest that, relative to a market with price-setting by drug manufacturers and patients who face coinsurance, PBMs reduce overall spending by 28%, without greatly limiting patient access. Without demand inertia, the presence of PBMs would cause prices to fall significantly as competitors enter.
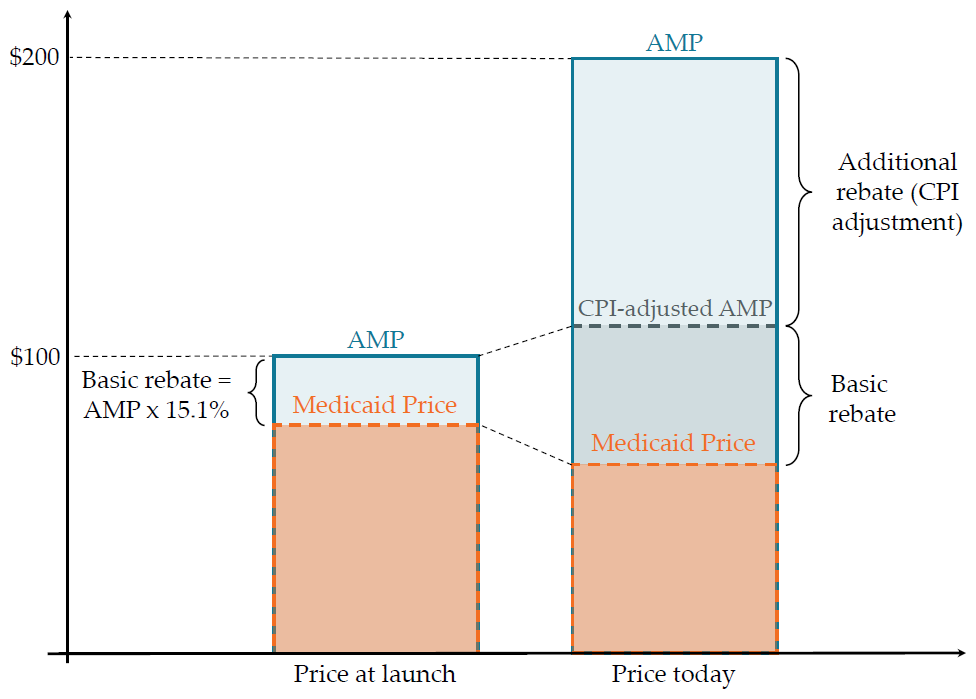
Using a difference-in-difference approach, we find that an increase to Medicaid’s minimum drug rebate under the Affordable Care Act in 2010 lowered non-Medicaid drug spending by 2.5 percent. A stylized bargaining model shows that this is likely driven by the interaction of this reform with Medicaid’s “most-favored customer” clause (MFCC). By examining the response of drugs that faced a change in incentives equivalent to the removal of Medicaid’s MFCC, we estimate that removing the Medicaid MFCC would have reduced overall 2010 non-Medicaid drug spending by an additional 3.5 percent, though it would have likely also increased Medicaid spending.
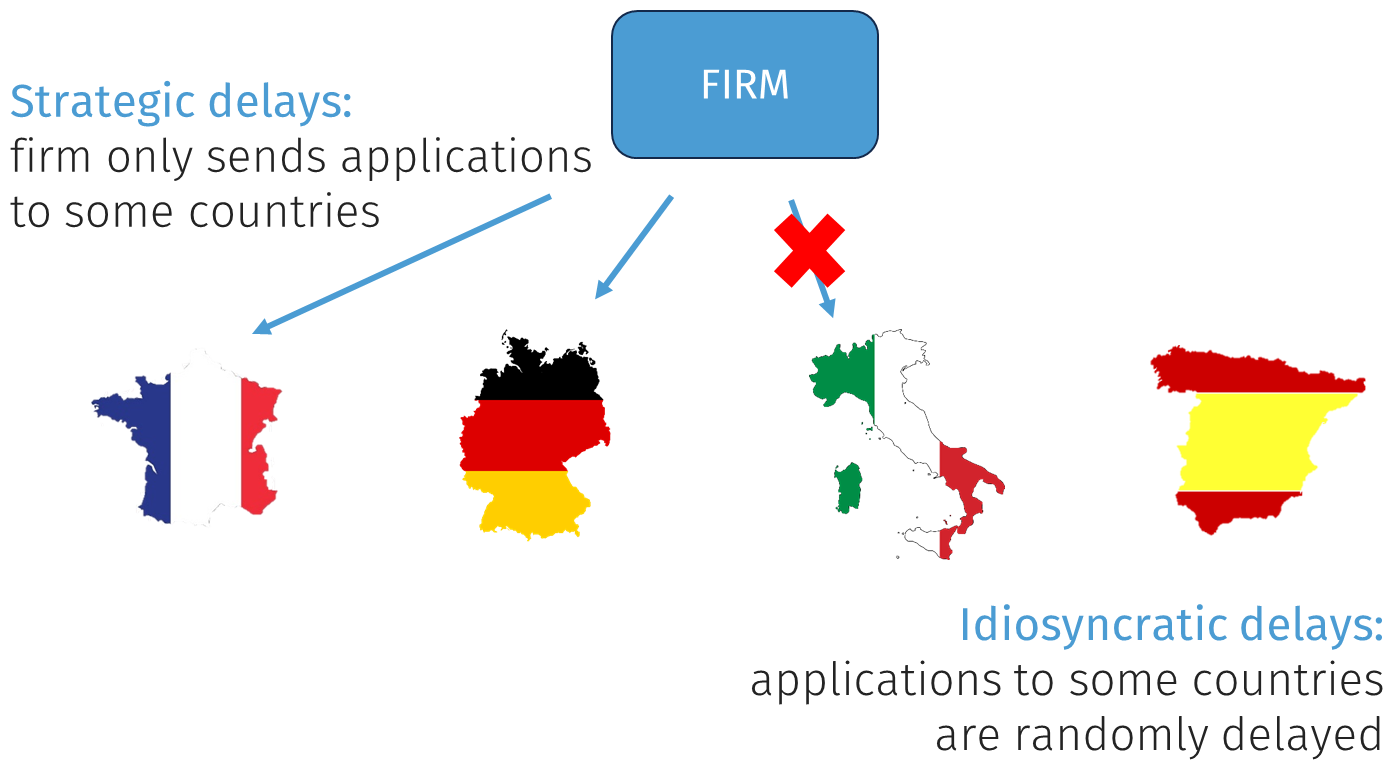
External reference pricing (ERP), the practice of benchmarking domestic drug prices to foreign prices, generates an incentive for firms to withhold products from low-income countries. Using a novel moment inequality approach, we estimate a structural model to measure how ERP policies affect access to innovative drugs across Europe. We find that ERP increases entry delays in eight low-income European countries by up to one year per drug. The European Union could remove these delays without replacing ERP by compensating firms through lump-sum transfers at the cost of around €18 million per drug.
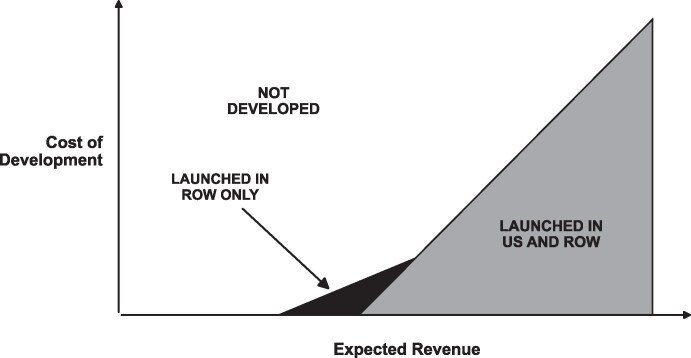
Background: The elasticity of pharmaceutical innovation with respect to market size is a key input for evaluating pricing reforms, yet published estimates vary widely. Objective: We examine how much of this variation reflects measurement choices—such as which drugs are counted in innovation outcomes and which countries are included in market size measures—rather than differences in research design. Data and Methods: Using a comprehensive dataset of global pharmaceutical sales, we estimate period-class Poisson regressions following the specification of Dubois et al. (2015), systematically varying the sample of drugs and the measure of market size. Results: Under our preferred specification, estimated elasticities range from 0.21 to 0.30, with estimates as high as 0.47 in other specifications. Restricting to drugs launched in the United States or other large, high-income markets yields significantly higher elasticities than the global sample, but United States and global revenue measures produce similar estimates within each sample, contrary to a common conjecture in the literature. Conclusions: Matching the right elasticity to the right policy question is essential for accurate projections; analysts should select estimates from studies whose measurement choices align with the specific policy and outcomes under evaluation.
Introduction: Access to prescription drugs is an enduring challenge in patient care. Payers often rely on coverage restrictions to balance access and cost.
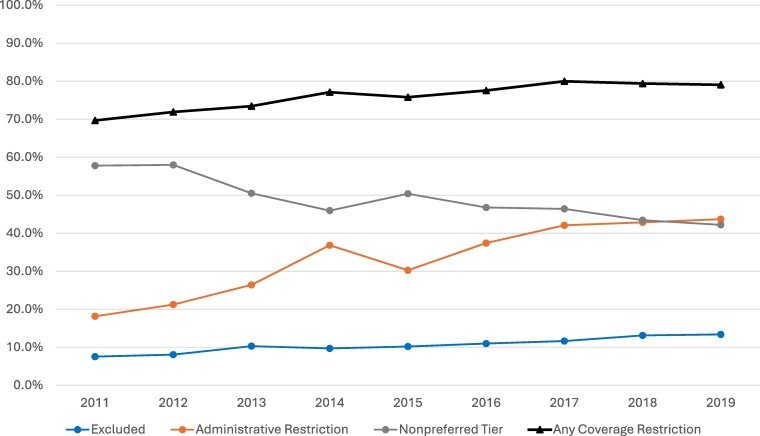
Methods: We assessed coverage restrictions for a comprehensive set of branded retail drugs without generic competitors from 2011 to 2019 across the four largest US market segments (Medicare, Medicaid, employer-sponsored, and health insurance exchanges) using CMS and Managed Market Insight and Technology (MMIT) data.
Results: Between 2011 and 2019, for the nationally representative beneficiary, the share of drugs excluded from formularies increased from 7.5% to 13.4%, the share of drugs subject to administrative restrictions such as prior authorization or step therapy increased from 18.1% to 43.7%, and the share of drugs on non-preferred tiers decreased from 57.8% to 42.2%. The share of drugs with any coverage restriction increased from 69.7% to 79.0%. Health plans and drugs subject to federal coverage mandates saw much larger increases in prior authorization and increases in non-preferred status.
Conclusion: These dynamics suggest that future research should study the tradeoffs between partial and full coverage restrictions for patient utilization, spending, and well-being.
We reflect on how Medicare Part D formulary design could facilitate access to biosimilars, create cost-savings, and motivate investment in biosimilar development. We evaluated adalimumab, a self-administered biologic for inflammatory conditions with the most approved biosimilars, including interchangeable as a case study. We found that formulary access in Part D for adalimumab biosimilars is lower relative to the innovator. Moreover, when adalimumab biosimilars are on the formulary, beneficiaries typically pay coinsurance, a cost higher than a fixed copay. This is unlike generic drugs, whose coverage in most Part D formularies typically has a co-pay of $5 or less (Dusetzina SB, Cubanski J, Nshuti L, et al. Medicare Part D plans rarely cover brand-name drugs when generics are available. Health Aff [Millwood]. 2020;39[8]:1326-1333. https://doi.org/10.1377/hlthaff.2019.01694). The US biosimilar market has been slow to grow, limiting potential cost-savings. The investment required to develop and manufacture a biosimilar is larger than that for a generic and requires a greater return for investment, and many off-patent biologics lack a biosimilar competitor (Arad N, Staton E, Hamilton M, et al. Realizing the Benefits of Biosimilars: Overcoming Rebate Walls. Duke Margolis Center for Health Policy; 2022). The Food and Drug Administration's October 2025 effort to simplify evidence requirements for biosimilarity may reduce development costs, but without market access financial returns from development are limited (Food and Drug Administration. FDA moves to accelerate biosimilar development and lower drug costs [press release]. October 29, 2025. https://www.fda.gov/news-events/press-announcements/fda-moves-accelerate-biosimilar-development-and-lower-drug-costs). Policies to encourage formularies to expand access to biosimilars in programs such as Medicare could motivate investment.
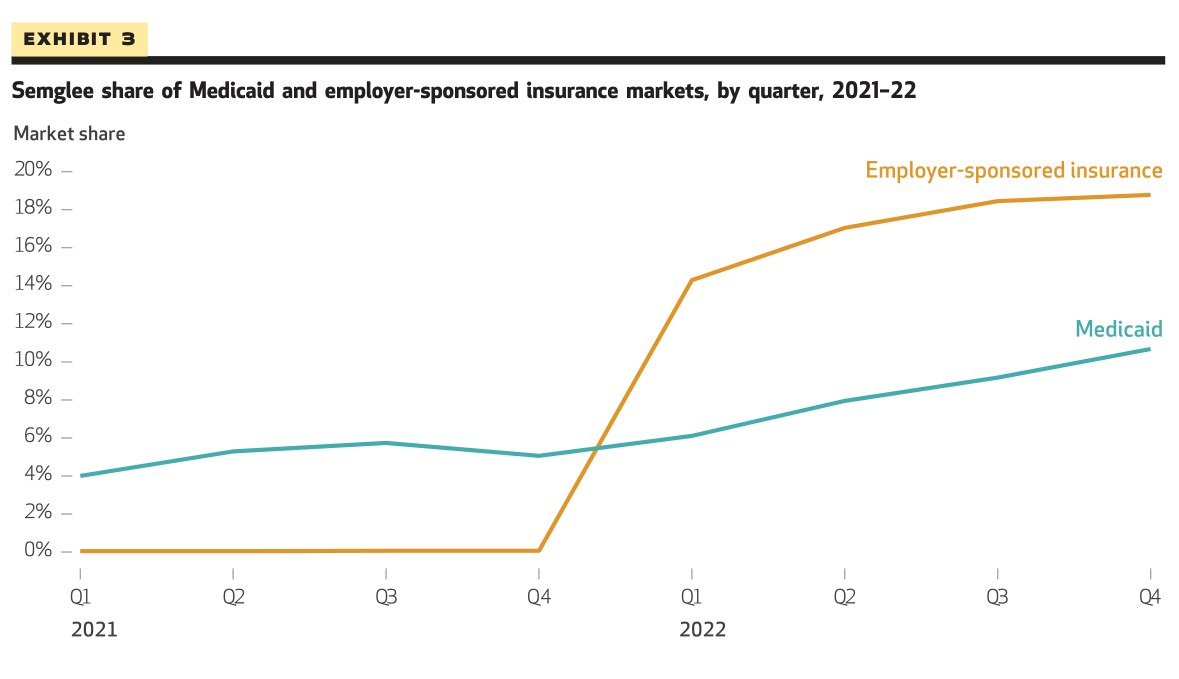
Interchangeability, a Food and Drug Administration (FDA) designation allowing pharmacists to substitute a biosimilar for its branded originator at the point of sale, is intended to increase biosimilar adoption. However, little is known about the relationship between interchangeability and biosimilar adoption. We conducted an interrupted time-series analysis to examine this relationship for Semglee, which gained interchangeability in July 2021, in Medicaid and the employer-sponsored insurance market in 2021–22. Semglee is a biosimilar for Lantus (insulin glargine), the most-prescribed long-acting insulin in the US. We found that Semglee market share increased by 3.70 percentage points in Medicaid and 19.25 percentage points in employer-sponsored insurance beginning in the first quarter of 2022, coinciding with improved Semglee coverage, especially in employer-sponsored insurance. State-level variation in pharmacist substitution laws was not associated with Semglee adoption. These results suggest that increased adoption was mediated mainly through improved insurance coverage, with no detectable role for increased prescribing alone and only a secondary role, at most, for pharmacist substitution. Semglee's gains in market share after interchangeability suggest that easing of federal interchangeability requirements may moderately spur biosimilar adoption.
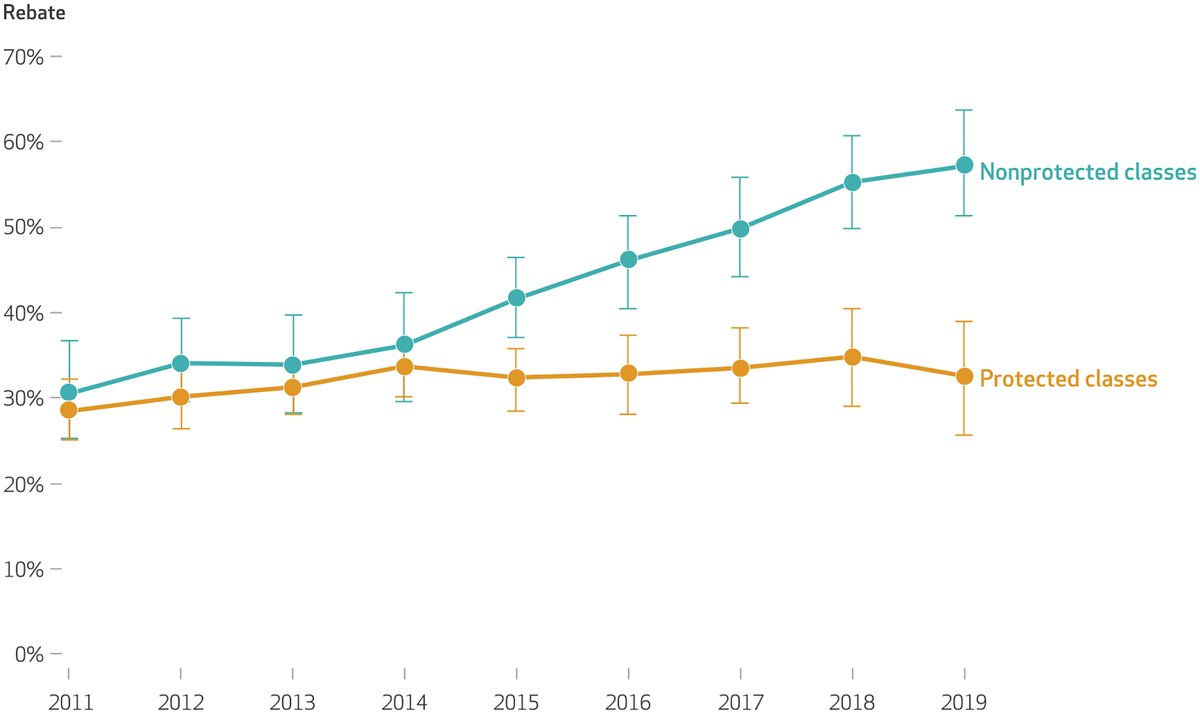
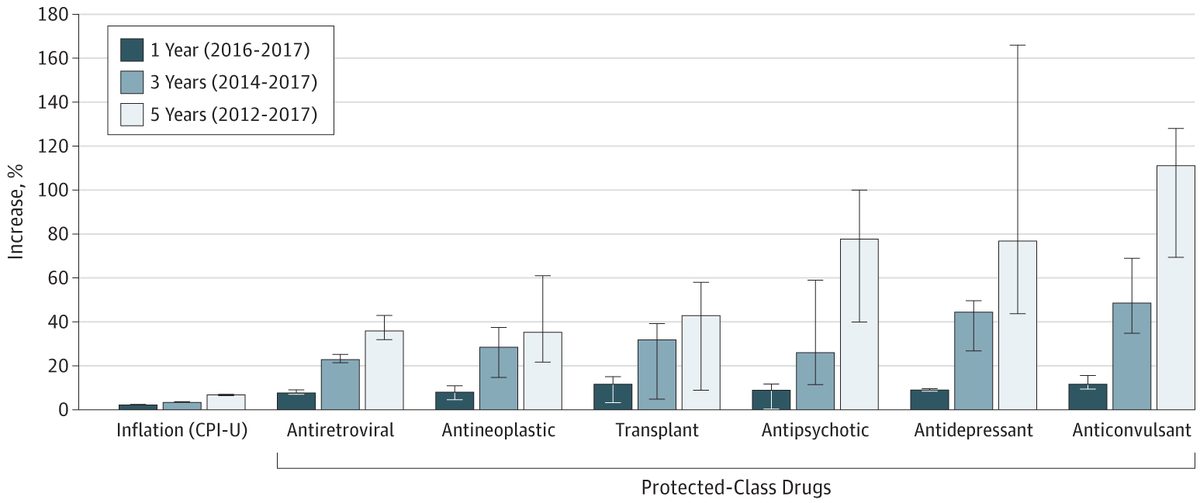
Medicare Part D does not allow plans to exclude drugs in six protected classes from their formularies, which may limit plans’ ability to negotiate rebates and lead to higher spending. We estimated the association between protected-class status, US-level estimated rebates, and formulary coverage during the period 2011–19. We found that protected classes indeed had significantly lower exclusion rates in Medicare Part D during this period relative to nonprotected classes, and this difference was larger than the corresponding difference in commercial plans. US-level average rebates grew 22.5 percentage points less in protected than in nonprotected classes during 2011–19, a period when formulary exclusions increased. Relative to nonprotected classes, US-level average rebates in protected classes were especially low among drugs with high Medicare market share. These results suggest that Medicare Part D protected-class policy may reduce rebates.
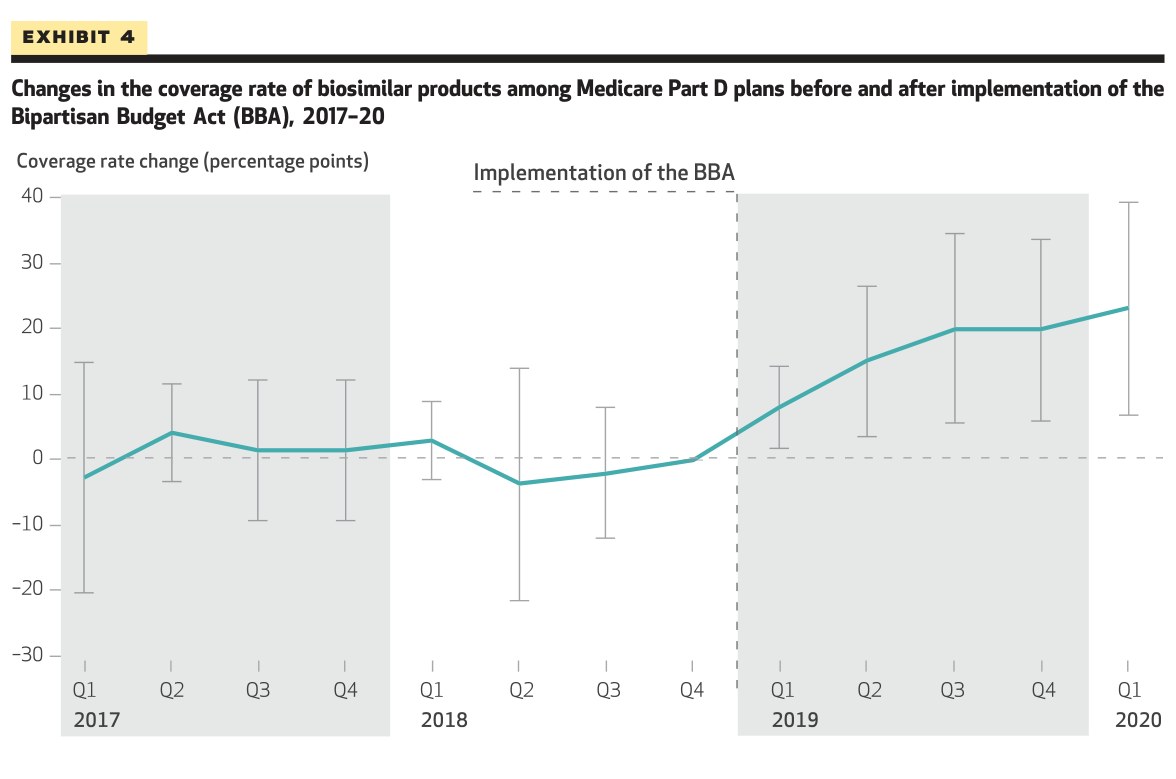
There is substantial disparity between Medicare Part D and employer-sponsored health insurance plans in the coverage of biosimilars and their reference biologics. These disparities may be due to design elements of Part D plans that encourage the adoption of more expensive biologic drugs. We undertook several analyses to illustrate the dynamics of benefit design incentives over time, compare formulary coverage in Part D plans with that of employer-sponsored plans, and study how the Bipartisan Budget Act of 2018 affected Part D formulary coverage. Using these analyses of Part D reforms enacted through the Bipartisan Budget Act, we discuss the implications of elements of the Inflation Reduction Act of 2022 that will be implemented in 2025. Biosimilar coverage increased by 23 percentage points five quarters after the Bipartisan Budget Act was implemented. We predict that the Inflation Reduction Act will also have a positive effect on biosimilar coverage. Given ample evidence of a relationship between drug coverage and utilization, our results suggest that Medicare patients and the federal government could realize substantial savings if Part D formularies resembled those of employer-sponsored plans.
Importance: Biologic drugs account for a growing share of US pharmaceutical spending. Competition from follow-on biosimilar products (subsequent versions that have no clinically meaningful differences from the original biologic) has led to modest reductions in US health care spending, but these savings may not translate to lower out-of-pocket (OOP) costs for patients.
Objective: To investigate whether biosimilar competition is associated with lower OOP spending for patients using biologics.
Design, Setting, and Participants: This cohort study used a national commercial claims database (Optum Clinformatics Data Mart) to identify outpatient claims for 1 of 7 clinician-administered biologics (filgrastim, infliximab, pegfilgrastim, epoetin alfa, bevacizumab, rituximab, and trastuzumab) from January 2009 through March 2022. Claims by commercially insured patients younger than 65 years were included.
Exposure: Year relative to first biosimilar availability and use of original or biosimilar version.
Main Outcomes and Measures: Patients' annual OOP spending on biologics for each calendar year was determined, and OOP spending per claim between reference biologic and biosimilar versions was compared. Two-part regression models assessed for differences in OOP spending, adjusting for patient and clinical characteristics (age, sex, US Census region, health plan type, diagnosis, and place of service) and year relative to initial biosimilar entry.
Results: Over 1.7 million claims from 190 364 individuals (median [IQR] age, 53 [42-59] years; 58.3% females) who used at least 1 of the 7 biologics between 2009 and 2022 were included in the analysis. Over 251 566 patient-years of observation, annual OOP costs increased before and after biosimilar availability. Two years after the start of biosimilar competition, the adjusted odds ratio of nonzero annual OOP spending was 1.08 (95% CI, 1.04-1.12; P < .001) and average nonzero annual spending was 12% higher (95% CI, 10%-14%; P < .001) compared with the year before biosimilar competition. After biosimilars became available, claims for biosimilars were more likely than reference biologics to have nonzero OOP costs (adjusted odds ratio, 1.13 [95% CI, 1.11-1.16]; P < .001) but had 8% lower mean nonzero OOP costs (adjusted mean ratio, 0.92 [95% CI, 0.90-0.93; P < .001). Findings varied by drug.
Conclusions and Relevance: Findings of this cohort study suggest that biosimilar competition was not consistently associated with lower OOP costs for commercially insured outpatients, highlighting the need for targeted policy interventions to ensure that the savings generated from biosimilar competition translate into increased affordability for patients who need biologics.
OBJECTIVES: To develop a method for determining the effect of including drug costs in alternative payment models (APMs).
STUDY DESIGN: Retrospective claims analysis.
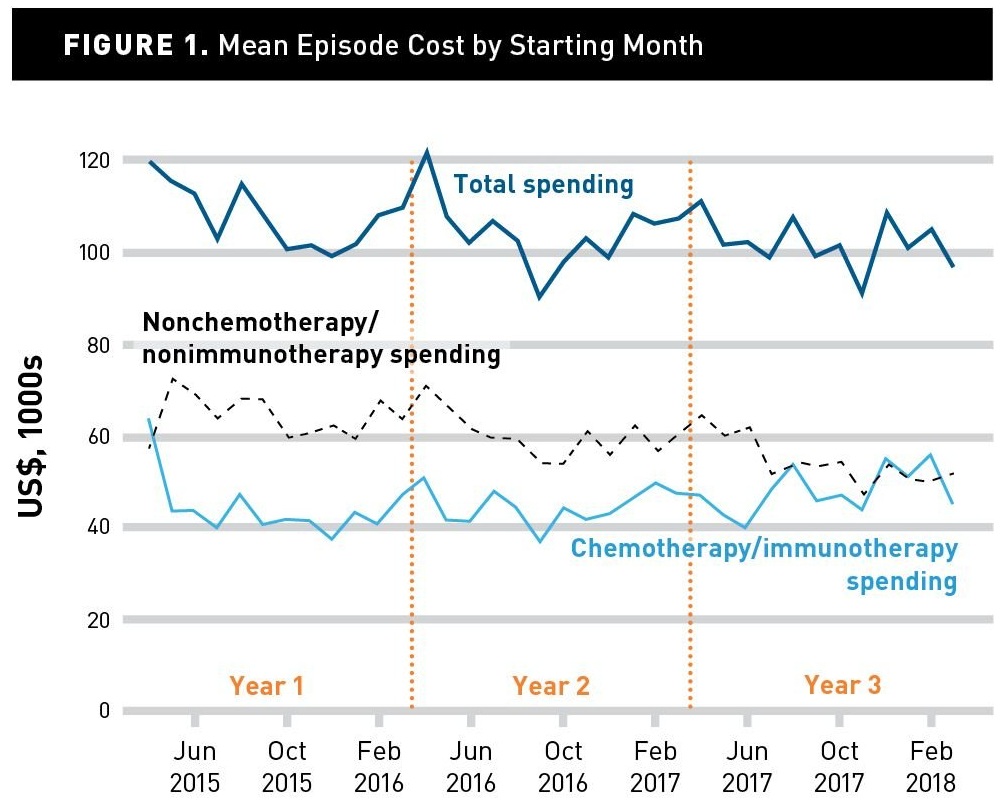
METHODS: Using the Oncology Care Model as an example, we developed an oncology episode payment model for a commercial payer using historical claims data. We defined 6-month episodes of chemotherapy. Using claims data, we characterized episodes and developed a risk adjustment model. We used bootstrapping to estimate the variation in episode cost with drugs included and without.
RESULTS: Episode costs were approximately $100,000. Although absolute cost variation was higher when we included drugs, the percent of total cost represented by variation was lower. Under reasonable assumptions about potential savings from drug and nondrug spending, our results suggest that including drugs in APMs can improve the risk-benefit trade-off faced by provider groups. We introduce a risk-mitigated sharing rate that may enable inclusion of drugs in APMs without substantially increasing downside risk.
CONCLUSIONS: We have developed a method to assess whether the inclusion of drug spending in APMs is a good decision for provider groups. Including drug costs in episode payments for oncology patients may be preferable for many provider groups.
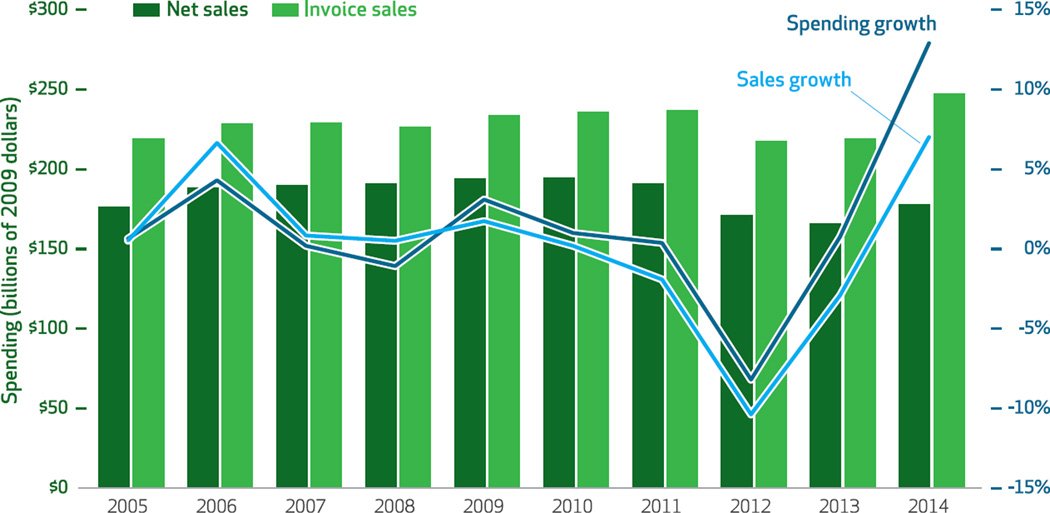
In the period 2005–13 the US prescription drug market grew at an average annual pace of only 1.8 percent in real terms on an invoice price basis (that is, in constant dollars and before manufacturers’ rebates and discounts). But the growth rate increased dramatically in 2014, when the market expanded by 11.5 percent—which raised questions about future trends. We determined the impact of manufacturers’ rebates and discounts on prices and identified the underlying factors likely to influence prescription spending over the next decade. These include a strengthening of the innovation pipeline; consolidation among buyers such as wholesalers, pharmacy benefit managers, and health insurers; and reduced incidence of patent expirations, which means that fewer less costly generic drug substitutes will enter the market than in the recent past. While various forecasts indicate that pharmaceutical spending growth will moderate from its 2014 level, the business tension between buyers and sellers could play out in many different ways. This suggests that future spending trends remain highly uncertain.
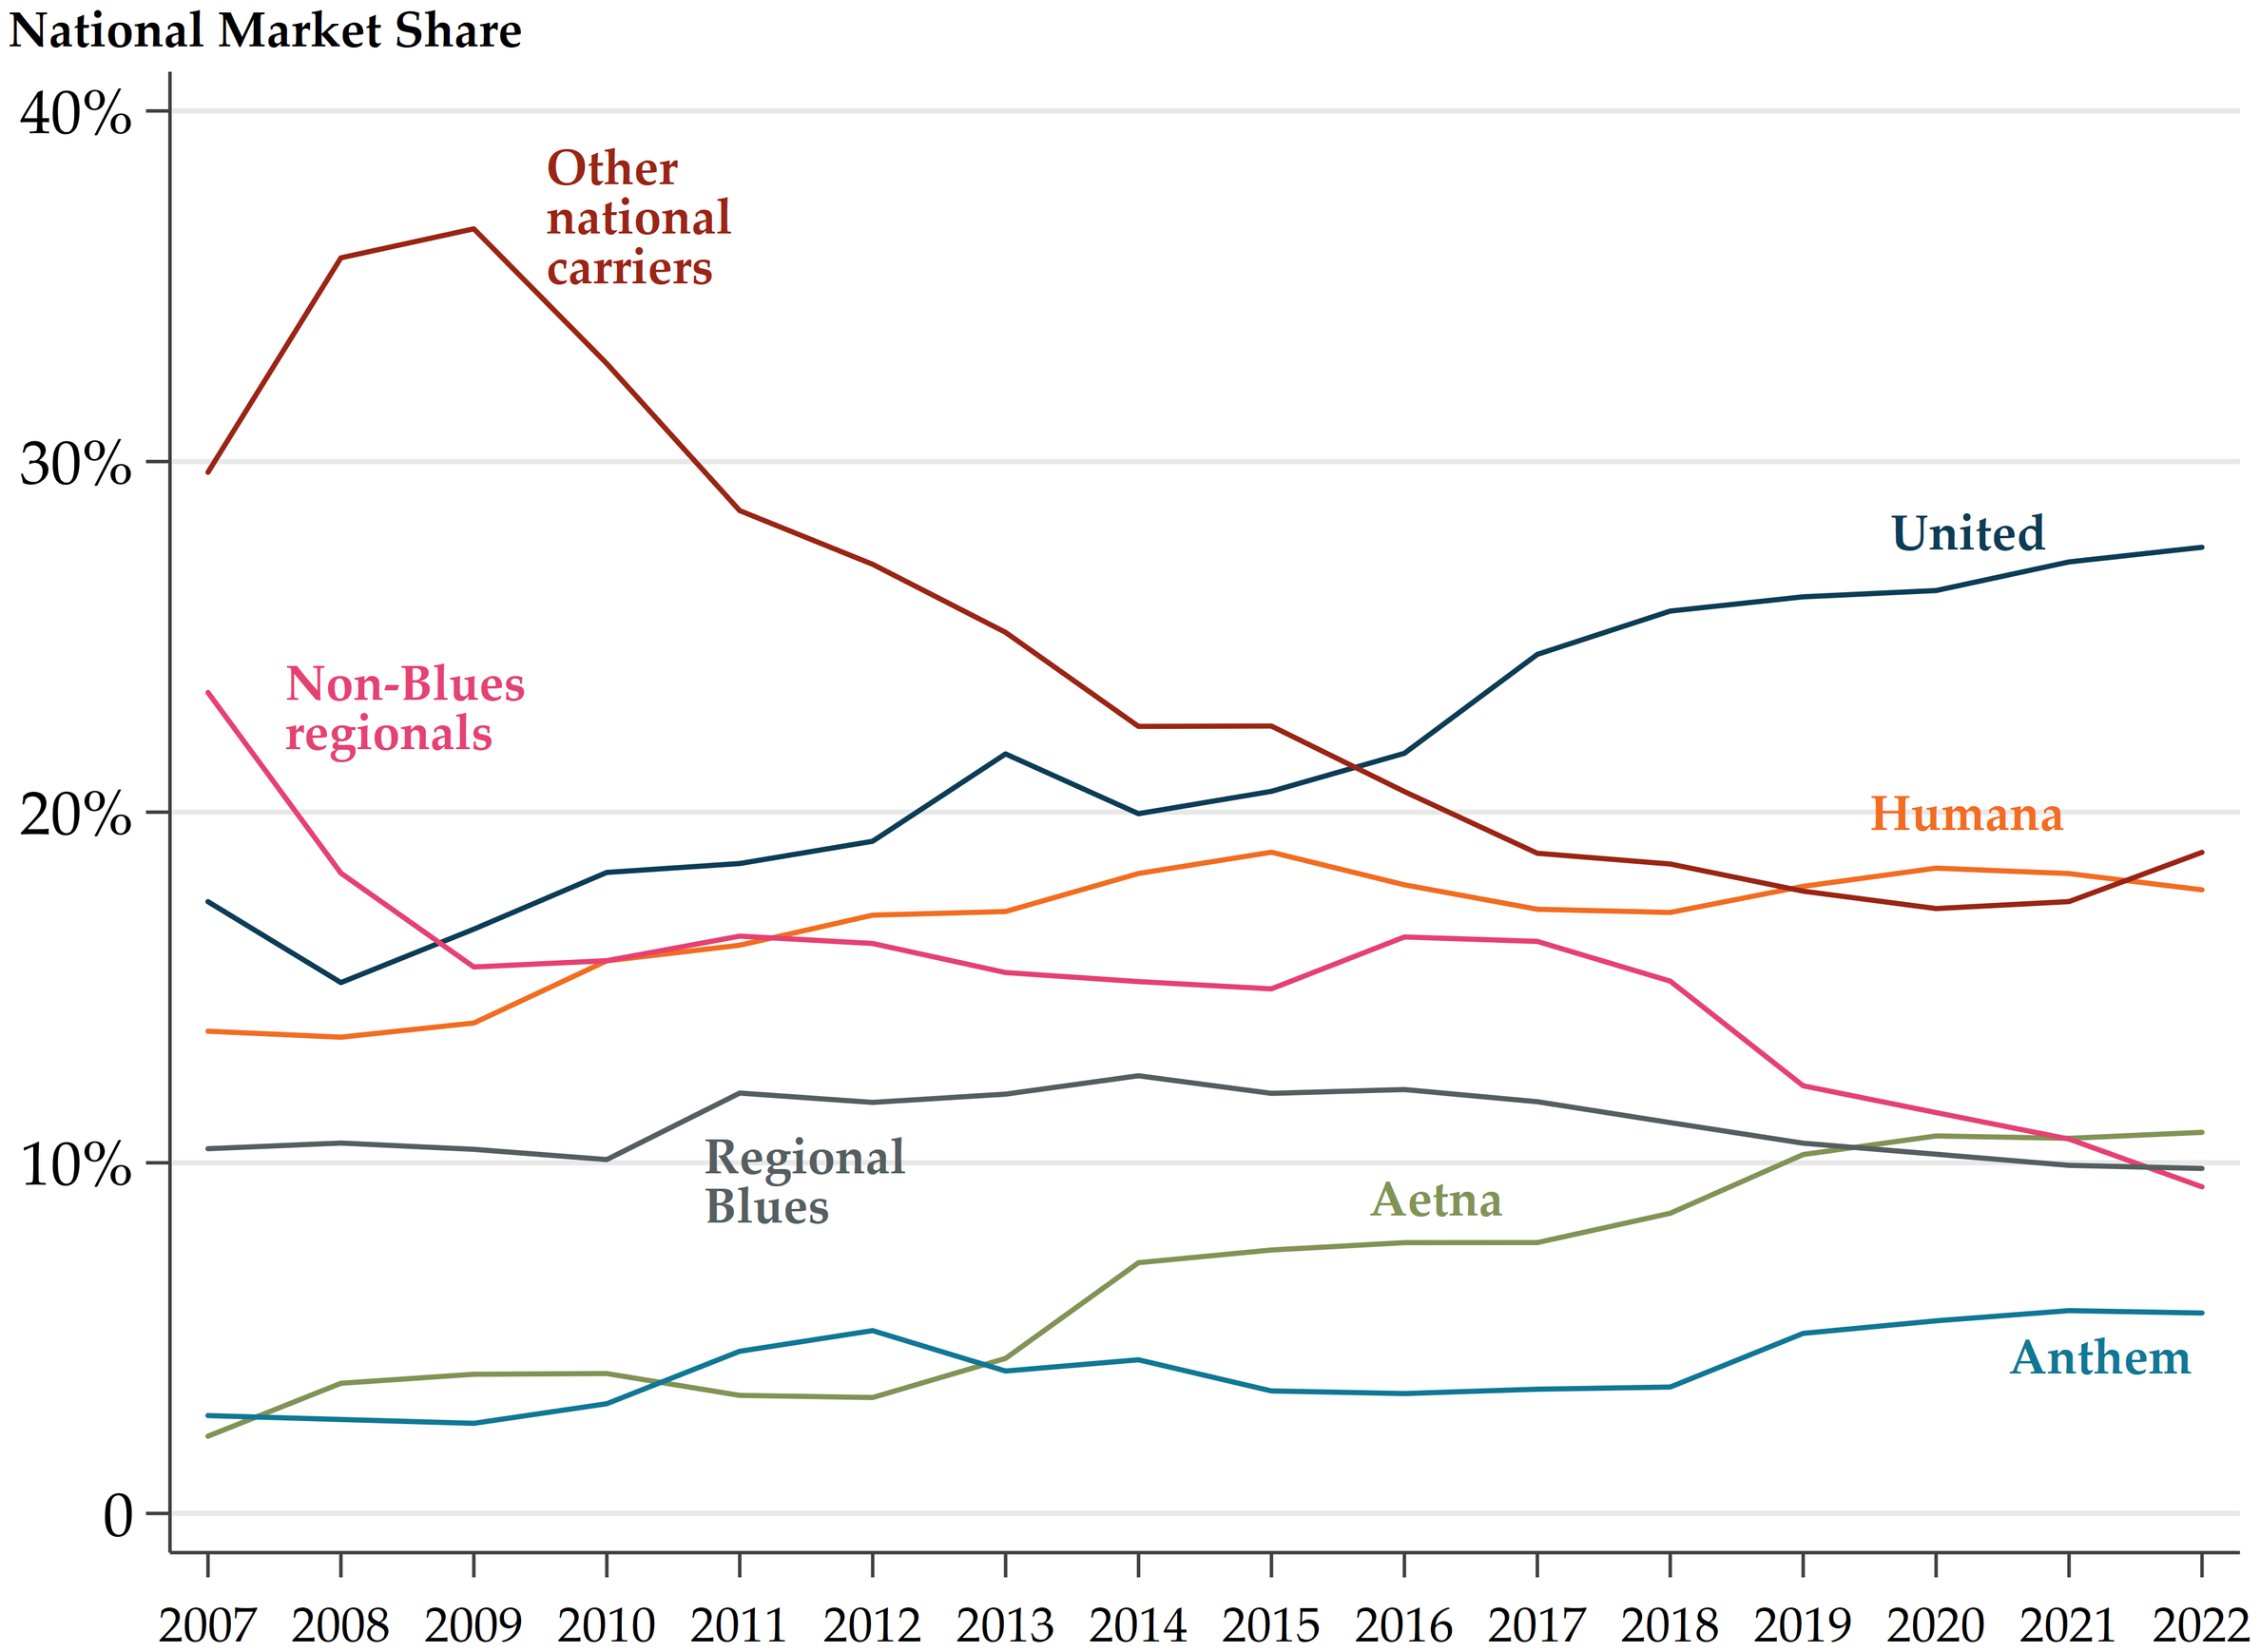
We assess the evolving role of competition in Medicare Advantage and its implications for beneficiary welfare. We describe how competition from the public option, traditional Medicare, and other private insurers within Medicare Advantage act as substitutes in incentivizing plans to deliver value. We show that while historically the choice between traditional Medicare and Medicare Advantage provided a vital competitive dynamic, traditional Medicare's strength as a competitor has declined significantly, driven by generous payments favoring private plans. Consequently, the burden of ensuring value for enrollees has shifted to competition within the Medicare Advantage market. While county-level competition among private insurers has increased, this growth is primarily driven by the expansion of large national carriers rather than new entrants. Insurers still wield substantial market power due to significant barriers to entry, raising concerns about the ability of the program to incentivize private insurers to use public dollars to maximize value for beneficiaries.
Elgar Encyclopedia on the Economics of Competition, Regulation and Antitrust (Michael D. Noel, ed.), Edward Elgar Publishing2024
The market for prescription drugs represents a fascinating case study of competition and regulation for three reasons. First, developing and commercializing new drugs is costly, time-consuming, and risky. New molecular compounds are subject to rigorous testing before they hit the market, a process that can last over a decade and during which most candidate compounds are scrapped. Second, it is characterized by a complex, competitive landscape where frictions generated by imperfect information, the presence of insurance, and monopoly power granted by the patent system can lead to inefficient outcomes. Third, because of the potential for market failure, it is highly regulated. Governments play a prominent role in funding primary research, overseeing the marketing approval process, and regulating prices once drugs hit the market.
Il prezzo dei farmaci (Fabio Pammolli, ed.), Società editrice il Mulino, Bologna2024
Prescription drug quality is an important variable in several strands of the health economics literature, including research on the value of medical R&D, the structure of the pharmaceutical markets, and the impact of innovation policy. In this paper, we provide a starting point for researchers interested in these topics by first summarizing the data, methodology, and literature surrounding the measurement of drug quality, and then highlighting areas of economic research that use quality measures. We conclude with a discussion of possible areas for future research.